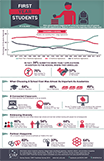
First Year Students at a Glance Infographic for TFS 2013
This entry is posted on behalf of Melissa Aragon.
 We are excited to highlight a new way we are helping CIRP Freshman Survey participating institutions show off their results. We are in the second year of our CIRP Freshman Survey infographic, and this time we are releasing an infographic highlighting some of the national data and providing a customizable version of the infographic for campuses to add their local findings. This customizable version of the infographic poster enables institutions to report their own results next to the national statistics to easily compare the two figures. In order to make this process a bit smoother, we also created a codebook to aid institutions in identifying the survey items reflected in the infographic. Please visit our infographic webpage.
Explore our “First Year Students at a Glance” infographic highlighting some of the findings from the 2013 CIRP Freshman Survey in an interesting display of icons and data. From a longitudinal look at the increasing number of college applications students are submitting to their use of technology and insight on their political viewpoints, the infographic poster provides a visually engaging perspective of the 2013 freshman class.
We have received great feedback about our infographic posters, and we plan to continue to provide this informative tool to share our survey results. Look for more infographics in the near future featuring our HERI Faculty Survey and our student follow-up surveys, including the Your First College Year survey, the College Senior Survey and the Diverse Learning Environments survey. All five of our 2014 surveys are currently open for administration and registration.
We hope you find the infographic useful in stimulating discussions on campus about your TFS results.
